







Nepal has opened the new fiscal year 2083/84 with a powerful jolt to its trade numbers. According to fresh data released by the Department of Customs, Nepal’s total foreign trade climbed by a striking 35.44 percent in Shrawan (the first month of the fiscal year, mid-July to mid-August 2026), reaching Rs 226.14 billion. Both imports and exports posted sharp gains, but it is the near-doubling of exports that has caught the attention of economists and trade watchers tracking Nepal’s persistently lopsided trade balance.
This early surge in Nepal foreign trade sets an important tone for the fiscal year ahead. Whether the momentum can be sustained through the remaining eleven months will determine if Nepal is finally making a dent in its chronic trade deficit, or whether this is simply a high base effect driven by a handful of commodities such as cooking gas, soybean oil, and vehicles.
Key Highlights of Nepal’s Shrawan 2083/84 Trade Data
- Total foreign trade: Rs 226.14 billion, up 35.44 percent year-on-year
- Total imports: Rs 187.44 billion, up 31.04 percent
- Total exports: Rs 38.70 billion, up 61.72 percent
- Trade deficit: Rs 148.73 billion, up 24.88 percent
- Export share in total trade: 17.11 percent, up from the previous year
- Import share in total trade: 82.89 percent, down 3.25 percent
- India remains Nepal’s largest trading partner by a wide margin
These figures, compiled from customs records at Nepal’s border points and international airports, offer the earliest official signal of how the country’s trade sector is performing in fiscal year 2083/84.
Imports Jump Past Rs 187 Billion in a Single Month
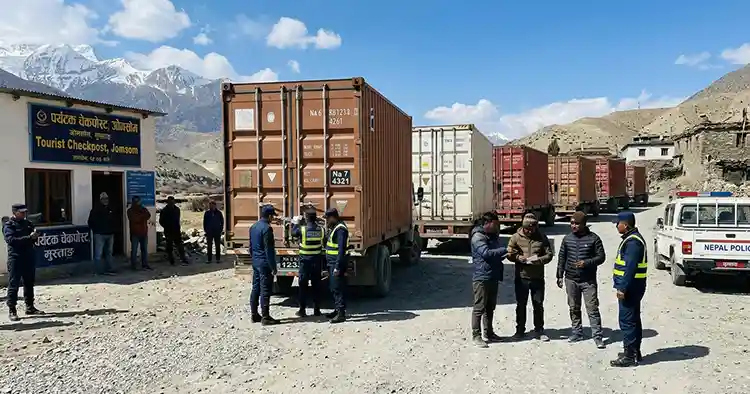
Nepal’s merchandise import bill for Shrawan 2083/84 stood at Rs 187.44 billion, a jump of 31.04 percent compared to the Rs 143 billion recorded in the same month last fiscal year. The increase spans nearly every major import category, from fuel and cooking gas to fertiliser, vehicles, and industrial raw materials, pointing to a broad-based recovery in domestic demand and construction activity rather than a spike confined to one sector.
Cooking Gas Import Bill Nearly Doubles
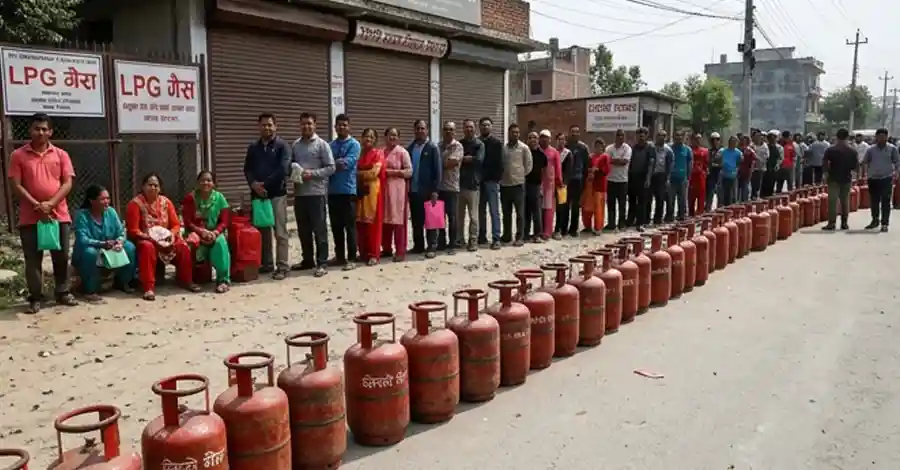
One of the standout numbers in the report is the cost of importing LP gas (cooking gas). Nepal spent Rs 8.46 billion importing 5.73 crore kilograms of cooking gas in Shrawan 2083/84, compared to Rs 4.66 billion for 4.43 crore kilograms in the same month a year earlier. That is close to a twofold jump in value, driven by both higher volumes and firmer international LPG prices. Combined with other petroleum products, Nepal’s total fuel import bill (including cooking gas) touched Rs 35.09 billion in just one month, compared with Rs 21.99 billion in the same period last year — a jump of nearly 60 percent.
For context on how fuel dependency shapes Nepal’s trade account, global energy price trends tracked by agencies such as the International Energy Agency show that South Asian import-dependent economies like Nepal remain highly exposed to swings in crude oil and LPG prices, since virtually all petroleum products are imported through India.
Edible Oil, Fertiliser, and Vehicles Also See Sharp Increases
Vegetable and animal ghee/oil imports came in as the second-largest import category, worth Rs 23.62 billion for the month. Fertiliser imports reached Rs 12.37 billion, up sharply from Rs 6.97 billion a year earlier, while imports of vehicles rose to Rs 11.72 billion compared to Rs 8.01 billion in the same month last year — an increase that hints at renewed consumer and commercial vehicle demand as financing conditions ease.
Iron and steel imports, closely watched as a proxy for capital and construction spending, stood at Rs 10.11 billion, a slight decline from Rs 11.09 billion in the same month of the previous fiscal year, suggesting that infrastructure-linked import demand has not grown at the same pace as consumption-linked categories.
Top Individual Import Items in Shrawan 2083/84
Ranked by value, the leading imported commodities were:
- Crude soybean oil – Rs 18.40 billion
- Diesel – Rs 13.85 billion
- Cooking gas (LP Gas) – Rs 8.46 billion
- DAP fertiliser – Rs 7.86 billion
- Petrol – Rs 6.88 billion
- Smartphones – Rs 3.87 billion
- Laptops and notebooks – Rs 1.20 billion
- Gold – Rs 1.01 billion
Notably, Nepal’s crude soybean oil import bill exceeded even its diesel and cooking gas bills for the month — a pattern that has persisted for several years because Nepal imports crude edible oil from third countries, refines it domestically, and re-exports a large share of it, mainly to India.
Exports Surge 61.72 Percent — A Rare Bright Spot
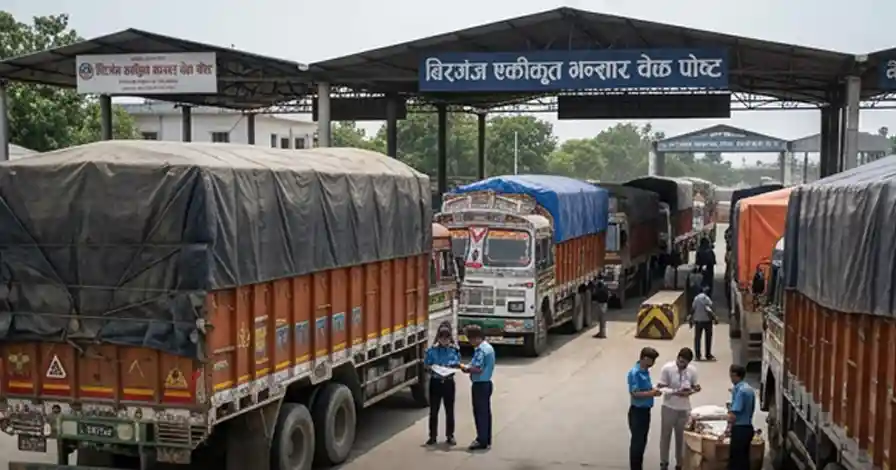
While imports grabbed headlines for their sheer size, the real story of Shrawan 2083/84 is Nepal’s export performance. Exports reached Rs 38.70 billion, a jump of 61.72 percent from Rs 23.93 billion in the same month last year. This pushed the export share of total foreign trade up to 17.11 percent, a meaningful improvement of 19.41 percent over the previous year’s share.
Vegetable Oil Re-Exports Continue to Lead Nepal’s Export Basket
As has been the trend in recent fiscal years, refined vegetable oil dominates Nepal’s export list. Refined soybean oil exports alone were worth Rs 17.99 billion in the month, effectively matching the entire crude soybean oil import bill. This re-export model — importing crude oil from third countries, refining it in Nepal, and shipping the refined product mainly to India — has become the backbone of Nepal’s formal export sector, even as it draws criticism from economists who argue it reflects processing-for-margin rather than genuine value-added manufacturing.
Other Leading Export Commodities
- Palm oil – Rs 1.29 billion
- Sunflower oil – Rs 1.20 billion
- Steel products – Rs 1.15 billion
- Jute goods – Rs 1.06 billion
- Carpets – Rs 0.84 billion
- Large cardamom (alaichi) – Rs 0.67 billion
Carpets and large cardamom, two of Nepal’s traditional signature exports, remain far behind refined vegetable oil in value terms, underscoring how concentrated Nepal’s export base still is. Trade researchers at platforms such as the Observatory of Economic Complexity have repeatedly flagged this lack of export diversification as a structural weakness in Nepal’s trade profile.
Trade Deficit Widens to Rs 148.73 Billion
Despite the encouraging export growth, Nepal’s overall trade deficit for the month rose to Rs 148.73 billion, up 24.88 percent from Rs 119.10 billion in the same month of the previous fiscal year. In simple terms, Nepal is still importing roughly five times more than it exports — a ratio that, while slightly improved from previous years, keeps Nepal reliant on remittance inflows and tourism receipts to balance its external accounts.
This pattern is consistent with wider assessments of Nepal’s economy. Multilateral bodies such as the World Bank have long noted that Nepal’s import bill vastly outweighs its exports, a gap traditionally financed by remittances from millions of Nepali migrant workers abroad rather than by trade earnings.
Why the Deficit Keeps Growing Even as Exports Rise
The widening deficit despite strong export growth comes down to simple arithmetic: Nepal’s import base is roughly five times larger in absolute rupee terms than its export base, so even a modest percentage increase in imports adds far more in absolute rupees than a large percentage increase in exports. A 31 percent rise on a Rs 143 billion import base adds roughly Rs 44 billion, while a 62 percent rise on a much smaller Rs 24 billion export base adds under Rs 15 billion — explaining why the trade gap keeps widening in rupee terms even as the export-to-import ratio slowly improves.
India Remains Nepal’s Dominant Trade Partner
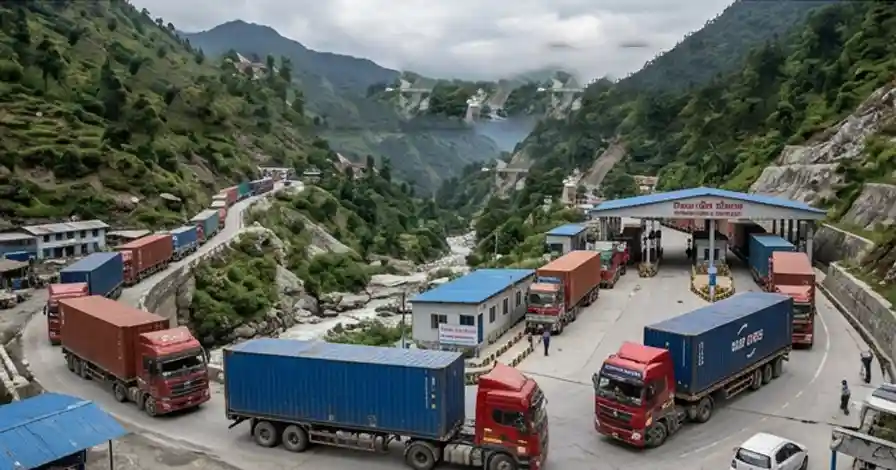
Nepal conducted foreign trade with more than 107 countries in Shrawan 2083/84, but the relationship with India continues to dwarf every other partnership.
Country-Wise Trade Breakdown
| Country | Imports (Shrawan 2083/84) | Exports (Shrawan 2083/84) |
|---|---|---|
| India | Rs 102.00 billion | Rs 33.26 billion |
| China | Rs 31.74 billion | Rs 0.21 billion |
| Argentina | Rs 13.85 billion | — |
| Saudi Arabia | Rs 4.98 billion | — |
| Russia | Rs 4.13 billion | — |
| United States | Rs 3.34 billion | — |
India alone accounted for imports worth Rs 102 billion and absorbed Rs 33.26 billion of Nepal’s exports, leaving a bilateral trade deficit with India of Rs 69.18 billion for the single month. China was the second-largest source of imports at Rs 31.74 billion, but Nepal’s exports to China remained negligible at just Rs 0.21 billion, highlighting the deep asymmetry in the Nepal-China trade relationship despite years of discussion around transit and connectivity agreements.
Argentina emerged as Nepal’s third-largest trading partner by volume, driven almost entirely by crude soybean oil imports worth Rs 13.85 billion, reflecting Nepal’s reliance on South American edible oil supplies for its vegetable-oil refining and re-export industry. Saudi Arabia, Russia, and the United States rounded out the top trading partners, with Saudi Arabia and Russia’s numbers driven largely by petroleum-linked and fertiliser-linked trade.
For readers who want to explore Nepal’s full country-by-country and commodity-by-commodity trade data, the Department of Customs, Nepal publishes detailed monthly and annual foreign trade statistics, while the Nepal Rastra Bank tracks the balance-of-payments implications of these trade flows, including how remittances offset the deficit.
What This Means for Nepal’s Economy in 2083/84
A Strong Start, But Sustainability Is the Real Test
Economists tracking Nepal’s trade data caution that a single month of strong growth — even one as sharp as 35.44 percent — does not guarantee a full-year trend. Shrawan figures are frequently influenced by seasonal restocking after the Nepali New Year period, monsoon-related import timing, and base-year comparisons that can exaggerate percentage changes. The real test will be whether export growth, particularly outside the vegetable-oil re-export channel, can be sustained through the winter and spring months when festival-related consumption typically drives import demand higher.
The Structural Challenge: Export Concentration
Nepal’s export basket remains heavily tilted toward a small number of processed commodities, with refined soybean oil alone making up nearly half of total exports in the month. This concentration leaves Nepal’s export earnings vulnerable to shifts in Indian tariff policy or duty structures on edible oil, since India is both the source of crude oil imports (indirectly, through global suppliers) and the primary market for Nepal’s refined exports. Diversifying into cardamom, tea, handicrafts, IT services, and manufactured goods remains a long-standing policy goal that has yet to meaningfully shift the export mix.
Fuel and Fertiliser Costs Remain a Persistent Drag
The near-doubling of the cooking gas import bill and the sharp rise in fertiliser imports both point to Nepal’s continued heavy dependence on imported energy and agricultural inputs. As monsoon agricultural activity picks up and fertiliser demand rises ahead of the paddy season, further increases in this category are likely in the coming months, adding continued pressure to the import bill and, by extension, the trade deficit.
How Shrawan 2083/84 Compares With Recent Fiscal Years
Looking at the last few years of Shrawan-month data helps put the 35.44 percent jump into perspective. Nepal’s trade sector has swung between sluggish and strong growth depending on import restrictions, foreign-exchange reserve pressures, and global commodity cycles. A few years ago, Nepal Rastra Bank tightened import rules on vehicles, gold, and other non-essential goods to defend foreign-exchange reserves, which temporarily suppressed import growth. As those restrictions have eased and reserves have stabilised, imports have rebounded sharply — a pattern visible in the 31.04 percent import growth recorded this Shrawan.
On the export side, the picture is more encouraging. Nepal’s exports have posted double-digit growth in several recent fiscal years, largely on the back of vegetable-oil re-exports to India. The 61.72 percent jump recorded in Shrawan 2083/84 continues that trajectory, though trade economists note that headline export growth figures driven by a single commodity category can mask stagnation elsewhere in the export basket. Broader national trade summaries covering full fiscal years, including comparative country-partner breakdowns, are available through data platforms such as Amarnepal’s Nepal trade dataset, which tracks the country’s roughly 6.5-to-1 import-to-export ratio across all 157 recorded trading partners.

Policy Context: Budget 2083/84 and the Customs Structure
The strong trade numbers for Shrawan also arrive against the backdrop of a revised customs and tariff structure introduced in the federal budget for fiscal year 2083/84. The government compressed the customs duty structure from 11 tariff slabs down to 7, lowered customs rates on more than 270 items — many of them industrial raw materials — and abolished excise duty on 360 product categories to support domestic manufacturing. This simplification, aimed at making raw-material imports cheaper relative to finished goods, could partly explain why categories like iron, steel, and industrial inputs showed relatively contained growth even as consumer-facing imports such as vehicles and smartphones rose sharply.
For businesses and importers trying to plan around the new structure, the practical impact depends heavily on individual HS (Harmonized System) codes, since the government replaced several scattered customs-point levies — including the infrastructure development tax and road maintenance fee — with a single unified green tax. Traders are advised to verify their product classifications against the Finance Bill schedules published by the Ministry of Finance before finalising import cost calculations for the rest of fiscal year 2083/84.
What Importers and Exporters Should Watch Next
For businesses operating in Nepal’s trade sector, a few indicators from the Shrawan data are worth monitoring closely as the fiscal year progresses:
- Fuel and cooking-gas prices: With the cooking-gas import bill nearly doubling and total fuel imports up almost 60 percent, any further increase in global LPG or crude prices would directly widen Nepal’s import bill in the coming months.
- Edible-oil trade margins: Since crude soybean oil imports (Rs 18.40 billion) and refined soybean oil exports (Rs 17.99 billion) are so closely matched in value, shifts in India’s import duty on refined edible oil could quickly squeeze the margins that make this re-export trade profitable for Nepali processors.
- Vehicle and electronics demand: Rising imports of vehicles (Rs 11.72 billion) and smartphones (Rs 3.87 billion) suggest recovering consumer spending power, a trend retailers and dealers will want to track against remittance inflow data from the Nepal Rastra Bank.
- Fertiliser supply timing: With fertiliser imports up from Rs 6.97 billion to Rs 12.37 billion, agricultural input suppliers should expect continued strong demand through the monsoon paddy-planting season.
Frequently Asked Questions on Nepal’s Foreign Trade Data
What is Nepal’s total foreign trade for Shrawan 2083/84? Nepal’s total foreign trade for the month reached Rs 226.14 billion, a 35.44 percent increase over the same month of the previous fiscal year.
How much is Nepal’s trade deficit in the first month of 2083/84? The trade deficit for Shrawan 2083/84 stood at Rs 148.73 billion, up 24.88 percent year-on-year.
Which country does Nepal trade with the most? India remains Nepal’s largest trading partner by a significant margin, accounting for Rs 102 billion in imports and Rs 33.26 billion in exports during the month.
What is Nepal’s top export item? Refined soybean oil was Nepal’s leading export in Shrawan 2083/84, worth Rs 17.99 billion, continuing a multi-year trend of vegetable-oil re-exports dominating Nepal’s export basket.
What is Nepal’s top import item? Crude soybean oil topped Nepal’s import list at Rs 18.40 billion, narrowly ahead of diesel at Rs 13.85 billion.
The Bottom Line
Nepal’s foreign trade data for Shrawan 2083/84 tells a story of two simultaneous trends: an economy still deeply dependent on imported fuel, edible oil, fertiliser, and vehicles, and an export sector that — for one month at least — grew fast enough to slightly improve its share of the trade pie. Whether this translates into a genuine narrowing of Nepal’s trade imbalance over the full fiscal year will depend on factors well beyond any single month’s customs data, including global commodity prices, monsoon agricultural output, and India’s trade and tariff policies toward its northern neighbor. For now, the Department of Customs’ numbers give policymakers, importers, and exporters an early, and cautiously encouraging, read on how fiscal year 2083/84 is shaping up.
Source: Department of Customs, Government of Nepal. Figures are preliminary and subject to revision in the department’s official annual trade publication.

Economic Affair
- Budhigandaki Flood: 47 Rescued as Bridges Washed Away
- Nepal Supreme Court Handcuff Order: Police Barred From Routine Use
- 250+ Officials Deploy to Assess Rasuwa-Bhotekoshi Flood Damage
- Electricity VAT: Energy and Finance Ministers Strike Landmark Deal After Just 2 Months
- Nepal Inflation Shockingly Triples to 5.96% — Food and Transport Hit Hardest



Comments