

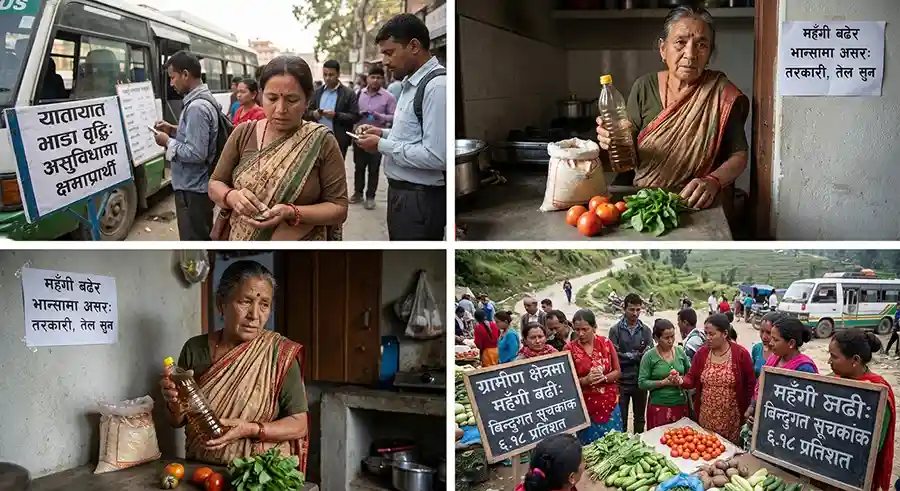





Nepal inflation has surged to 5.96 percent, more than tripling from just 1.68 percent a year earlier — and the sharpest pain is landing exactly where households feel it fastest: the kitchen and the commute. New Nepal Rastra Bank data shows cooking oil, fruit, meat and transport costs driving a price shock that is squeezing rural families harder than urban ones.
Nepal Inflation Jumps to 5.96% in the First Month of FY 2083/84
Kathmandu — Year-on-year consumer price inflation in Nepal reached 5.96 percent in Shrawan, the opening month of the current fiscal year 2083/84.
The comparison is stark. In the same month last year, the rate stood at just 1.68 percent. That means the headline Nepal inflation figure has risen more than threefold in twelve months.
The figures come from the central bank’s monthly “Current Macroeconomic and Financial Situation of Nepal” report, released on Friday by Nepal Rastra Bank.
Why the Jump Feels Bigger Than the Number
A move from 1.68 percent to 5.96 percent is not a gentle drift. It is a regime change in household budgets.
When inflation sits below 2 percent, wage earners barely notice. When it approaches 6 percent — concentrated in essentials rather than luxuries — the same salary buys visibly less food and fewer trips each month.
This is why the Shrawan reading matters more than a single data point normally would. It sets the tone for the entire fiscal year.
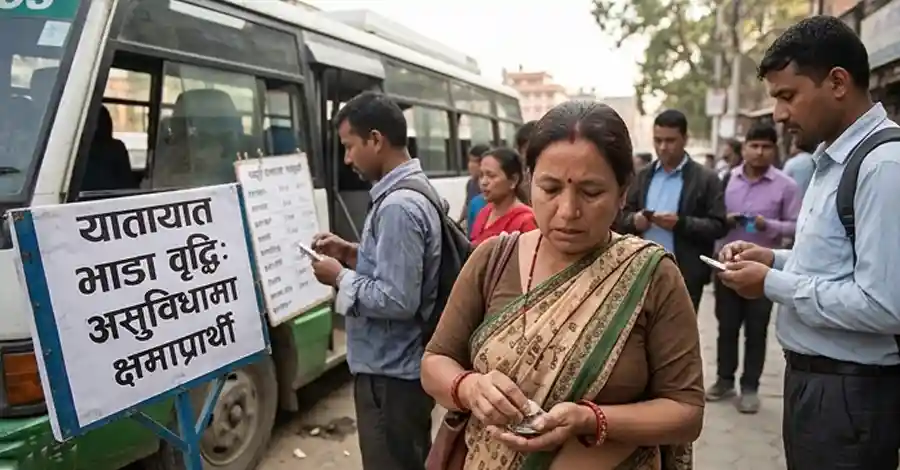
Food and Beverage Inflation at 6.77% — Ghee and Oil Lead the Surge
Under the food and beverage category, price increases were broad-based but heavily concentrated in kitchen staples.
Food sub-category price rises (year-on-year):
- Ghee and oil: 15.62% — the single steepest rise
- Fruit: 15.39%
- Fish and meat: 8.65%
- Vegetables: 6.90%
- Spices: 4.80%
Overall food and beverage inflation stood at 6.77 percent.
The Kitchen Basket Problem
Cooking oil and ghee are unavoidable purchases. Unlike discretionary spending, households cannot simply stop buying them when prices climb 15 percent.
The same applies to fish, meat and vegetables. When protein and fresh produce rise together, families typically respond by cutting quality or quantity — a form of hidden hardship that headline statistics rarely capture.
Nepal’s exposure to imported edible oil prices also means global market swings transmit quickly into local kitchens. The Food and Agriculture Organization’s Food Price Index tracks these international movements, and vegetable oil has been among the most volatile components worldwide in recent years.
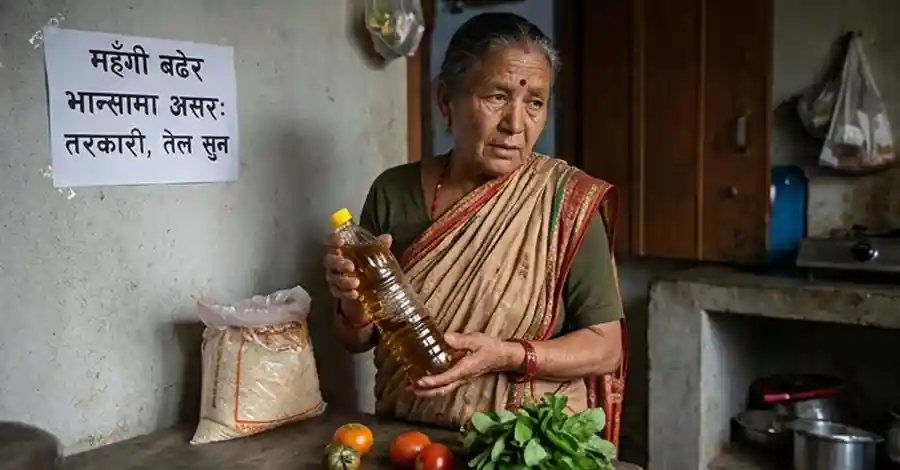
Transport Inflation Hits 13.17% — The Biggest Non-Food Shock
In the non-food and services category, overall inflation stood at 5.52 percent — lower than food, but containing one dramatic outlier.
Non-food sub-category price rises (year-on-year):
- Transport: 13.17% — the highest in the entire non-food group
- Alcoholic beverages: 7.20%
- Clothing and footwear: 5.52%
- Tobacco products: 4.97%
Why Transport Inflation Spreads Everywhere
Transport is not just a line item on a household budget. It is an input cost for almost everything else.
When fares and fuel rise 13 percent, the cost of moving vegetables from the Terai to Kathmandu rises too. So does the cost of delivering goods to hill and mountain districts. Transport inflation therefore acts as an amplifier, pushing up prices in categories that appear unrelated at first glance.
For daily commuters, small traders and delivery-dependent businesses, this is the most immediately painful number in the report.
Rural Nepal Is Paying More Than Urban Nepal
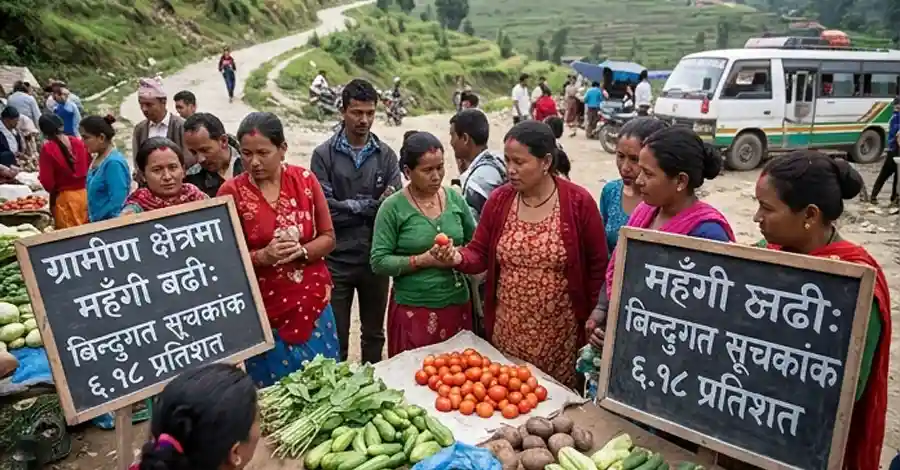
One of the report’s most important findings reverses a common assumption: prices are rising faster in villages than in cities.
- Rural areas: 6.18%
- Urban areas: 5.88%
The gap is not enormous, but the direction matters. Rural households generally have lower cash incomes and fewer substitution options. Longer supply chains, thinner local competition and higher transport costs per unit all push rural price levels upward.
The Distance Penalty
A price increase absorbed by a salaried household in Kathmandu can be a genuine crisis for a farming household in a remote ward — especially when transport costs are simultaneously climbing 13 percent.
Province-Wise Nepal Inflation: Madhesh Highest, Sudurpaschim Lowest
Regional variation in the Shrawan data is significant.
By province:
- Madhesh: 6.94% — highest in the country
- Sudurpaschim: 4.61% — lowest in the country
By geographic belt:
- Terai: 6.64%
- Hill: 5.95%
- Mountain: 5.10%
- Kathmandu Valley: 4.81%
A Gap of More Than Two Percentage Points
The spread between Madhesh at 6.94 percent and Sudurpaschim at 4.61 percent is over 2.3 percentage points — a substantial divergence within a single small economy.
Notably, Kathmandu Valley recorded one of the lowest readings at 4.81 percent, despite being the country’s most expensive place to live in absolute terms. High price levels and fast price growth are not the same thing, and this data separates them clearly.
What Rising Nepal Inflation Means for Households
1. Real Incomes Are Shrinking
If salaries stay flat while prices rise near 6 percent, purchasing power falls by roughly the same margin. For workers without annual increments, this is an invisible pay cut.
2. Savings Are Being Eroded
Deposit interest rates in Nepal’s banking system have trended downward in recent periods. When inflation approaches or exceeds deposit returns, savers effectively lose value by holding cash.
3. Monetary Policy Comes Under Pressure
Nepal Rastra Bank targets inflation within a defined band as part of its annual Monetary Policy. A sharp acceleration in the first month of the fiscal year raises questions about whether policy settings will need adjustment if the trend persists.
4. Remittance-Dependent Families Feel a Double Squeeze
Households relying on remittance income face rising domestic prices without any corresponding increase in what their family members earn abroad. Exchange-rate movements can help or hurt, but they rarely offset a 15 percent jump in cooking oil.
Is This a Spike or a Trend?
One month does not establish a trajectory — but it does establish a starting point.
The critical question is whether the drivers are temporary or structural. Supply-side shocks in edible oil and fruit can reverse quickly if global prices soften or harvests improve. Transport cost increases, by contrast, tend to be stickier, because fares once raised are rarely lowered.
Analysts will be watching three things in coming months: whether food inflation moderates after the monsoon harvest, whether transport costs stabilise, and whether the rural-urban gap widens further.
For readers tracking the broader picture, the World Bank’s Nepal data portal and the IMF country page for Nepal provide longer-run context on how the current rate compares with historical averages.
Key Takeaways
- Nepal inflation reached 5.96% in Shrawan, up from 1.68% a year earlier
- Food and beverage inflation: 6.77%; non-food and services: 5.52%
- Ghee and oil (+15.62%) and transport (+13.17%) were the steepest risers
- Rural inflation (6.18%) exceeded urban inflation (5.88%)
- Madhesh Province recorded the highest rate at 6.94%; Sudurpaschim the lowest at 4.61%
Prices have not simply drifted upward. They have moved sharply — and they have moved most in the two categories no household can avoid: what people eat, and how they get around.

Economic Affair
- Budhigandaki Flood: 47 Rescued as Bridges Washed Away
- Nepal Supreme Court Handcuff Order: Police Barred From Routine Use
- 250+ Officials Deploy to Assess Rasuwa-Bhotekoshi Flood Damage
- Electricity VAT: Energy and Finance Ministers Strike Landmark Deal After Just 2 Months
- Nepal Inflation Shockingly Triples to 5.96% — Food and Transport Hit Hardest


Comments